AtomWords
Insights
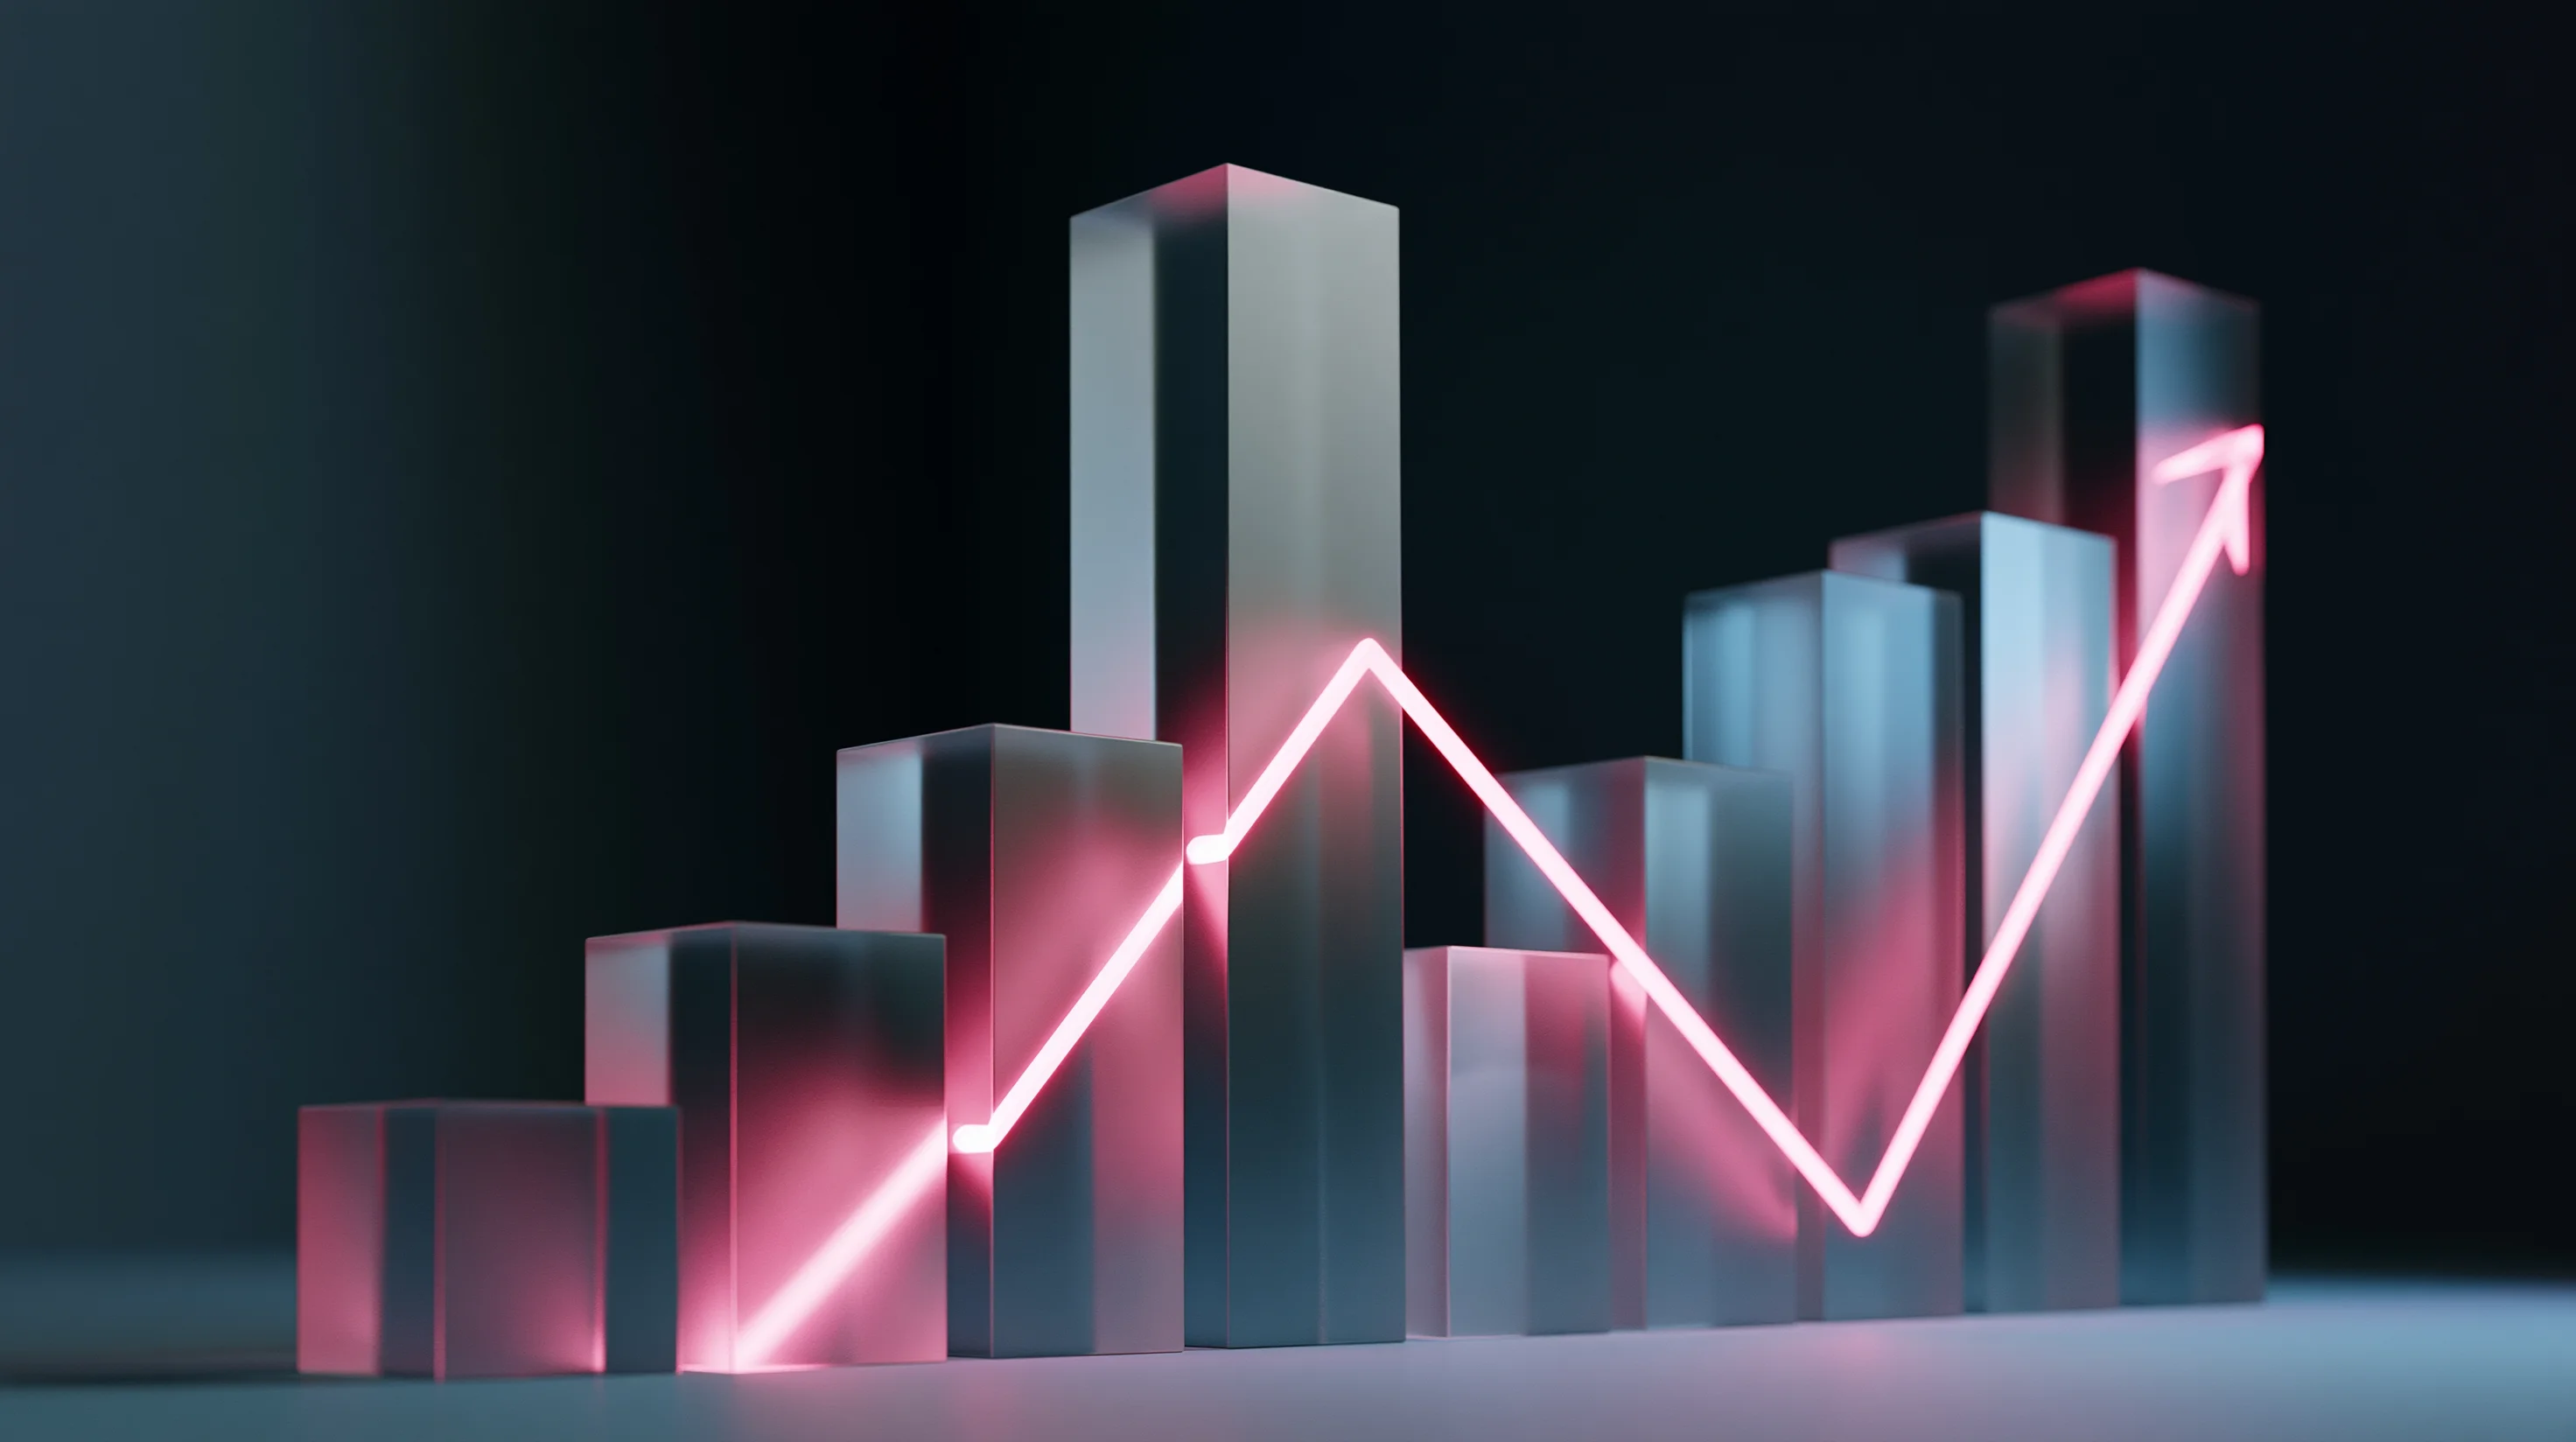
Refracting light with stunning realism, the 3D glass financial chart elevates data visualization into a high-end, transparent masterpiece of growth.
Premium Data Aesthetics
The 3D glass financial chart replaces boring, flat Excel graphs with a premium, metaphorical visual of success. Used heavily in fintech and venture capital marketing, its visual power relies on the realistic interaction of light with transparent and frosted glass surfaces.
To achieve this high-end look, emphasize refraction, caustic light patterns, and subtle internal glows. Combine frosted glass bars with a vibrant neon trend line to guide the viewer's eye. A common pitfall is over-complicating the grid lines; keep the background dark and minimal to let the glass materials capture and bend the light beautifully.
Full
Prompt
Prompt
A 3D glass financial chart showing upward growth, featuring semi-transparent frosted glass bars, a vibrant glowing pink neon trend line running through, highly detailed light refraction, set against a dark minimalist studio background, elegant corporate style --ar 16:9 --style raw
June 25, 2026